Mandelbrot & Julia Sets
Summer 2020
Summer 2020
I’ve always been amazed by fractals. They look infinitely complex, yet are actually simpler to represent using mathematics than you might expect.
![Romanesco Fractal]()
This picture of romanesco broccoli is one of my favourites.
The most astounding part for me is that they’re found all over nature - shells, leaves, coastlines. I think fractals are some of our clearest evidence that mathematics is the language of the universe. I wanted to experiment with generating my own, so wrote a script to visualise the Mandelbrot and Julia sets.
The Mandelbrot and Julia sets are defined pretty generally mathematically, but here I just describee their visualization.
To start, we look at a region of interest in the complex plane (for example the real and imaginary axes going from -5 to 5), and run each complex “point” z in the region (in reality there are infinite points, so we just take each pixel) through an expression. For Julia sets, this expression follows zk+1 = zkn + c, where n and c can be varied to generate many different patterns. Each point is iterated through the expression and if the value z exceeds a given magnitude R in a finite number of iterations, the iteration is recorded. Otherwise, the point z is said not to diverge and this is noted. A corresponding color map graphically represents the number of iterations for each pixel in the image, and if the point does not diverge it is left black.
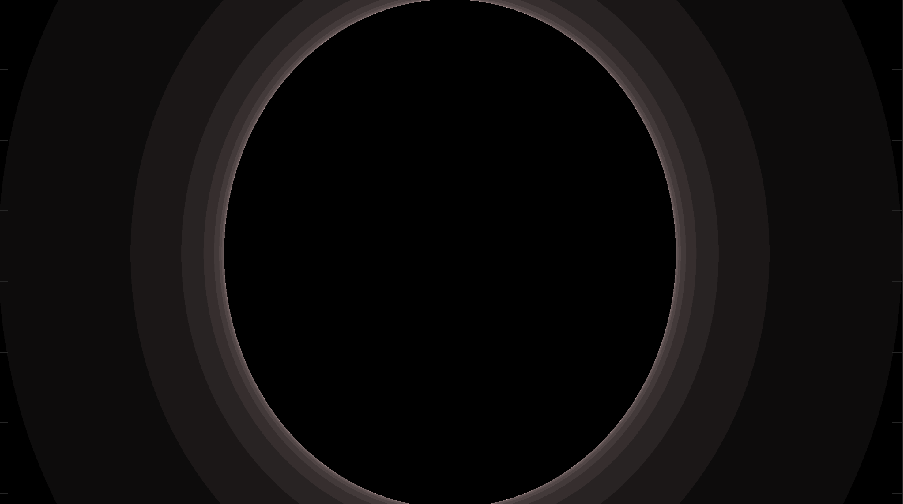
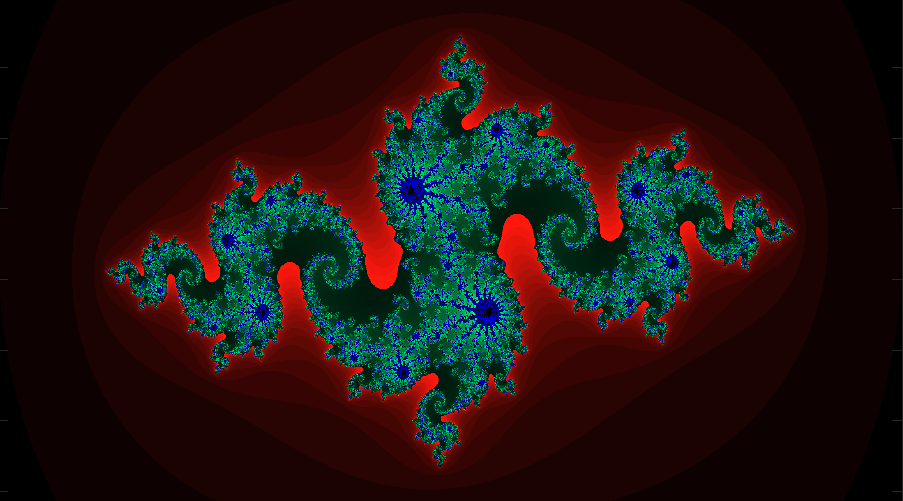
As an example, set n to 2 and c = 0.8 + 0.156i. With a convergence radius R set to 2, you produce the first picture below.
The Mandelbrot set is similarly generated, except each point in the region of interest is the fixed c in the above expression, n is always set to 2, R is set to 2, and z0 = 0 for each point iterated.
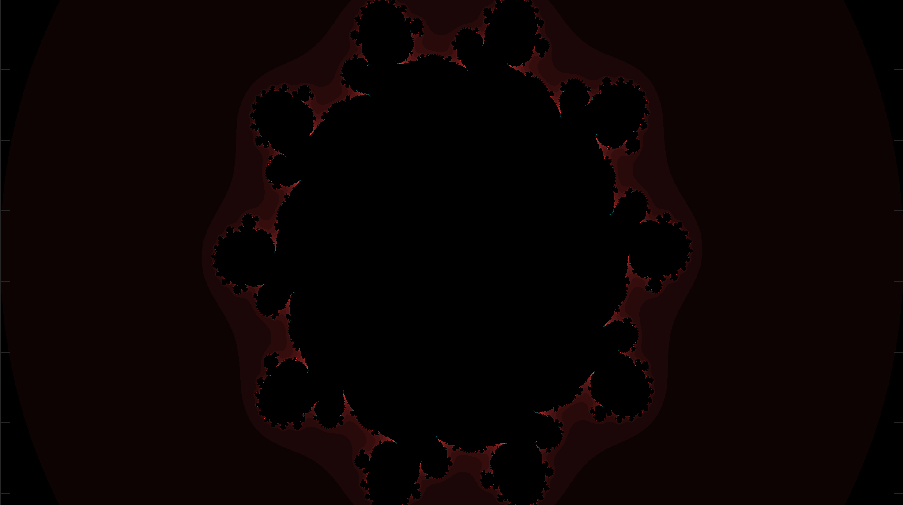
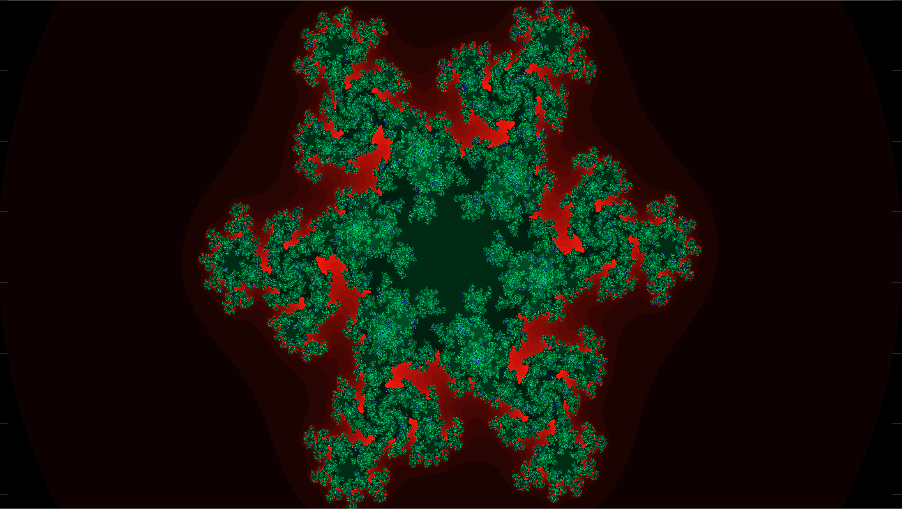
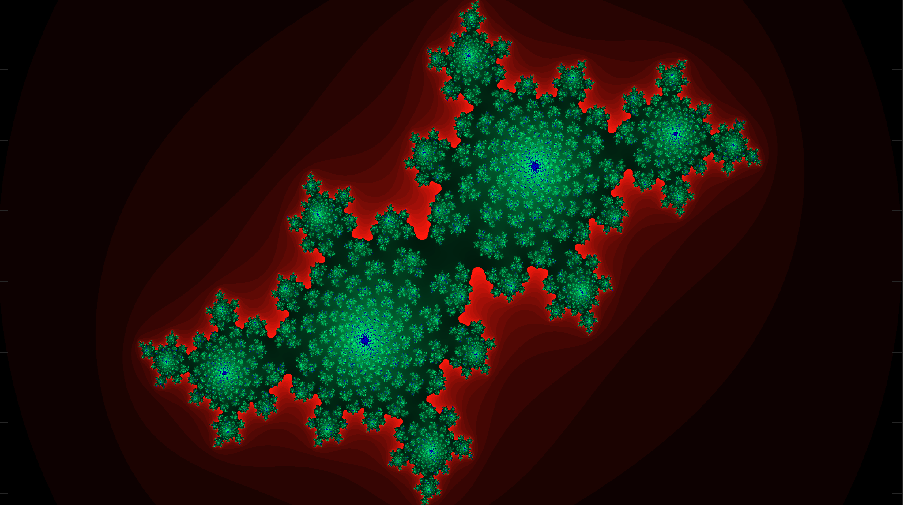
Below are a sample of some Julia set pictures generated using different constants and powers in the iterations.
![]()
![]()
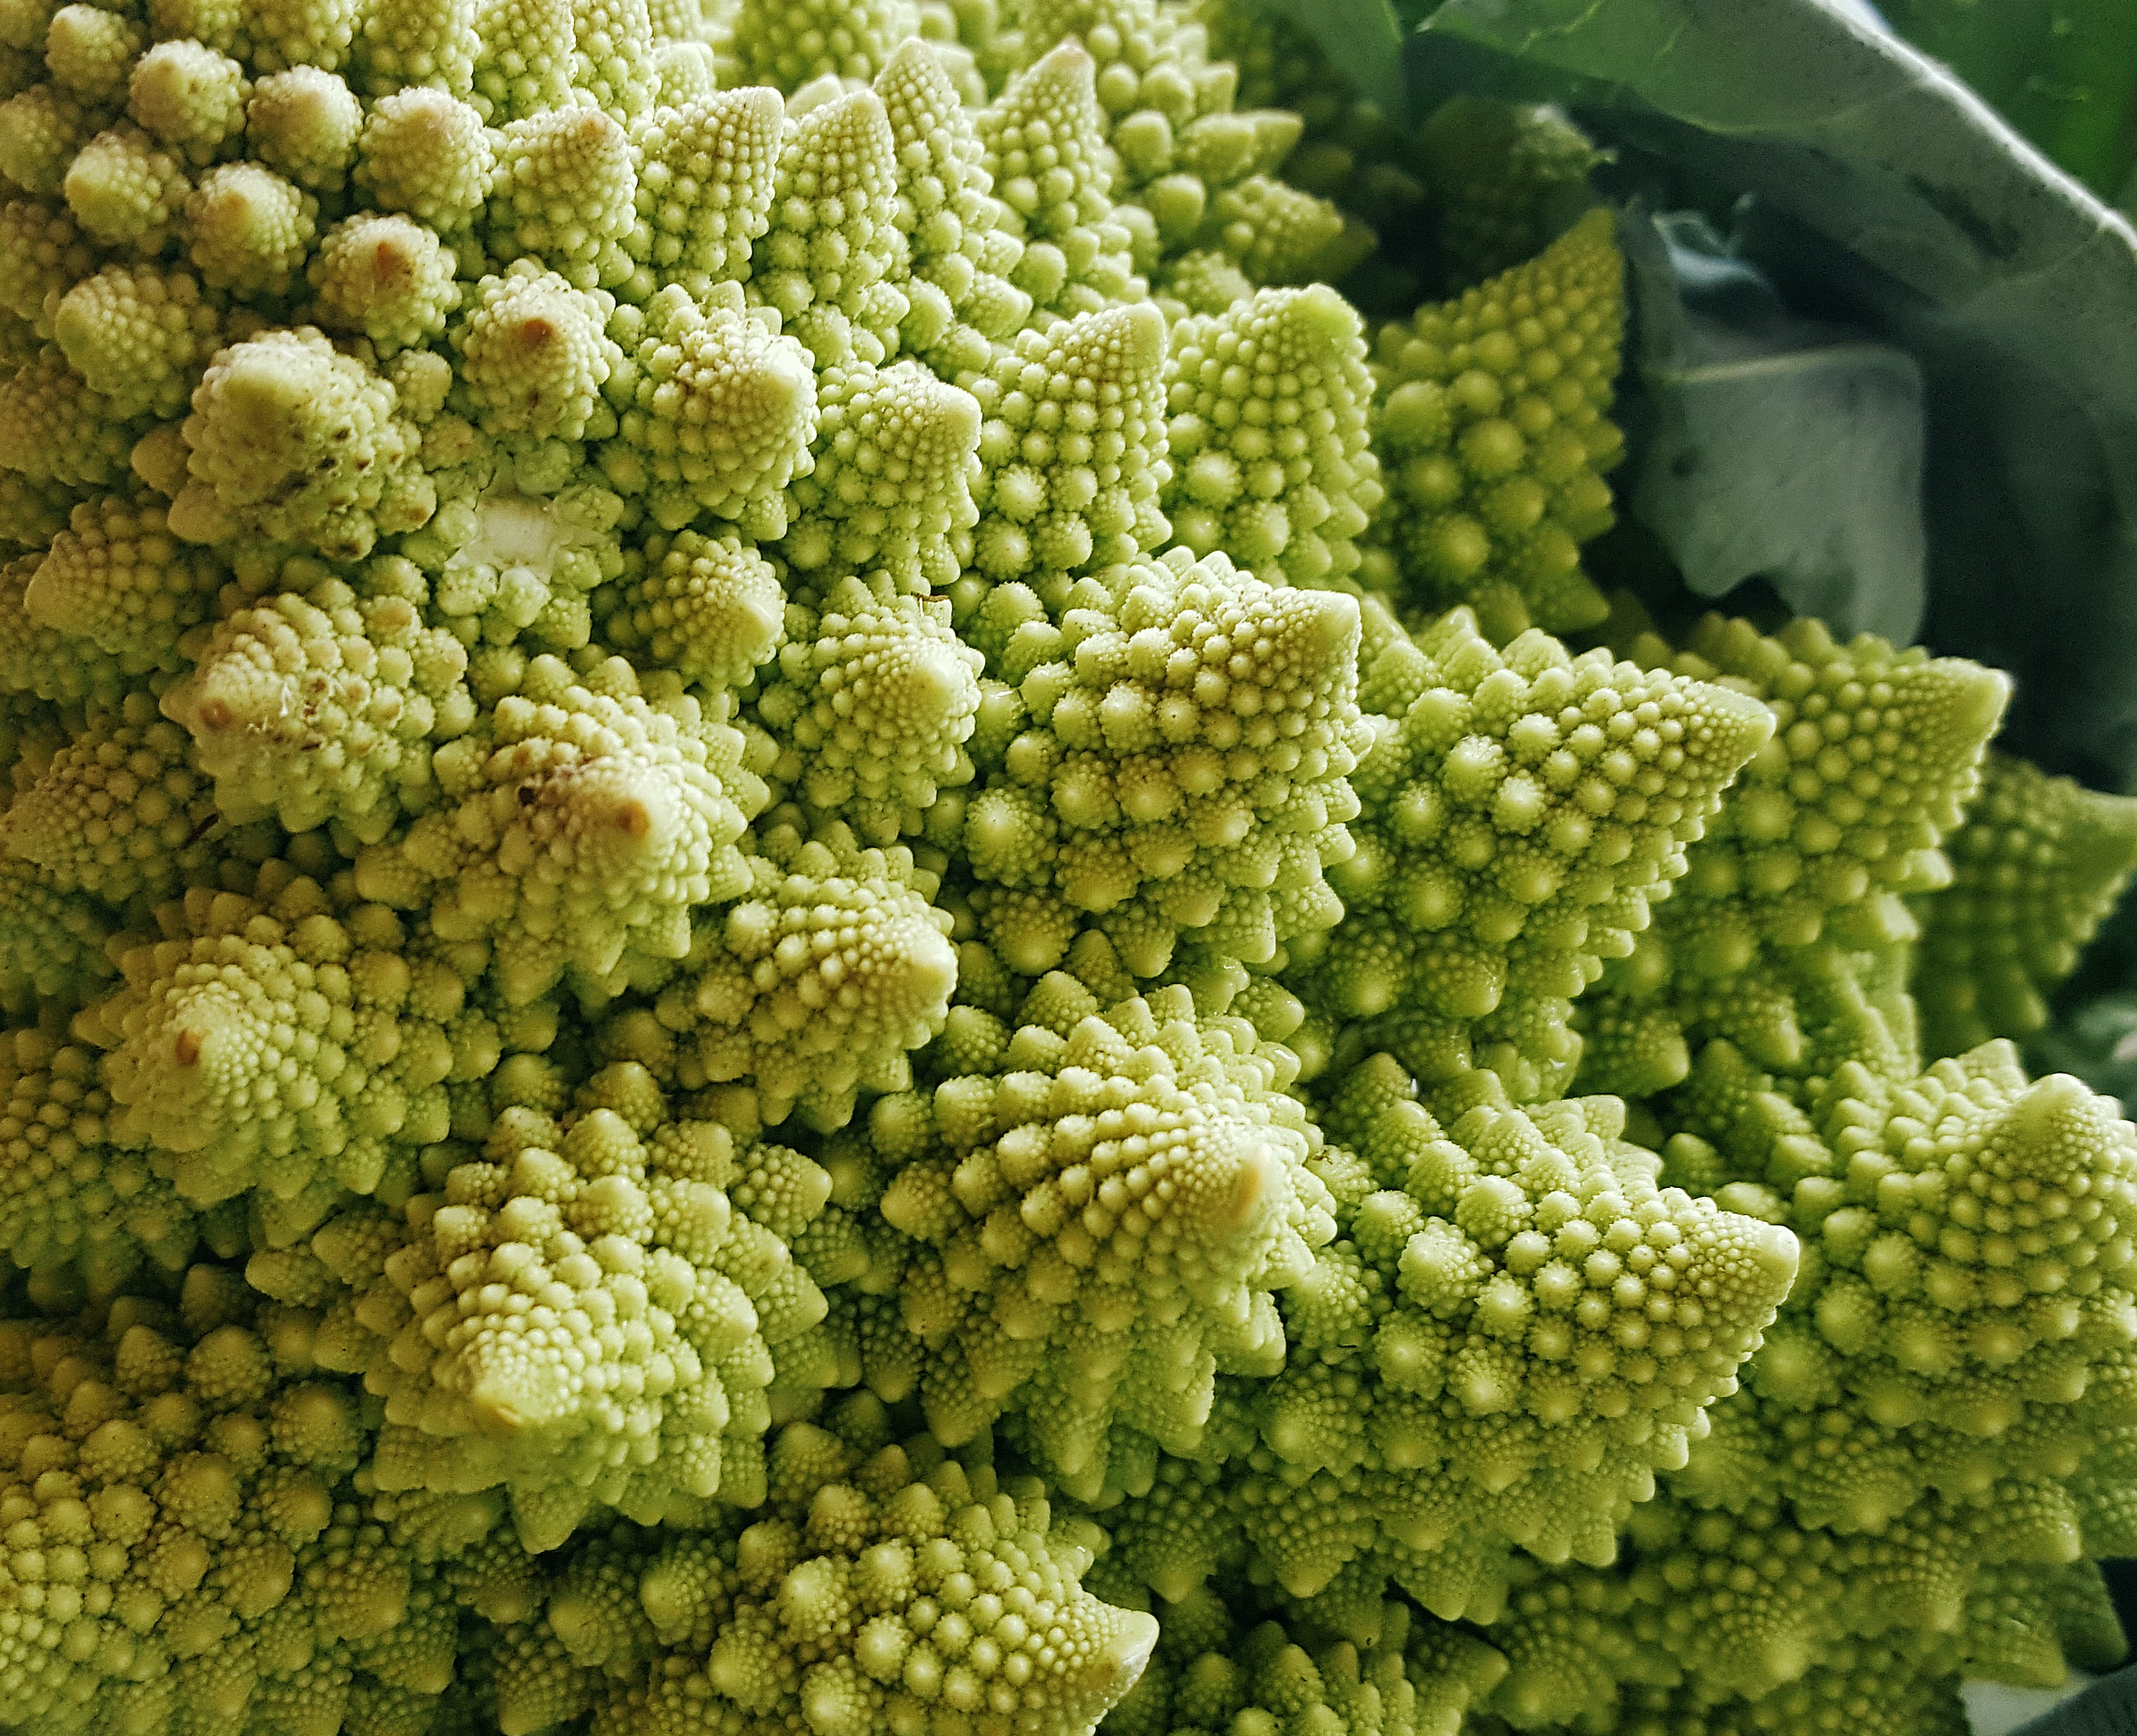
This picture of romanesco broccoli is one of my favourites.
The most astounding part for me is that they’re found all over nature - shells, leaves, coastlines. I think fractals are some of our clearest evidence that mathematics is the language of the universe. I wanted to experiment with generating my own, so wrote a script to visualise the Mandelbrot and Julia sets.
The Mandelbrot and Julia sets are defined pretty generally mathematically, but here I just describee their visualization.
To start, we look at a region of interest in the complex plane (for example the real and imaginary axes going from -5 to 5), and run each complex “point” z in the region (in reality there are infinite points, so we just take each pixel) through an expression. For Julia sets, this expression follows zk+1 = zkn + c, where n and c can be varied to generate many different patterns. Each point is iterated through the expression and if the value z exceeds a given magnitude R in a finite number of iterations, the iteration is recorded. Otherwise, the point z is said not to diverge and this is noted. A corresponding color map graphically represents the number of iterations for each pixel in the image, and if the point does not diverge it is left black.
As an example, set n to 2 and c = 0.8 + 0.156i. With a convergence radius R set to 2, you produce the first picture below.
The Mandelbrot set is similarly generated, except each point in the region of interest is the fixed c in the above expression, n is always set to 2, R is set to 2, and z0 = 0 for each point iterated.
Below are a sample of some Julia set pictures generated using different constants and powers in the iterations.

To comply with ITAR regulations and NDAs, all Astranis, Blue Origin, Northrop Grumman and SpaceX pictures shown are available publicly online
